Connecting PowerBI to Digital Hive Audit Data
Question
The Digital Hive Control Center doesn't seem to provide any reports or views around usage of the platform. Is there a way to create reports to show metrics like the amount of reports executed by platform, the number of searches being made, who is accessing Digital Hive (and when)?
Answer
The Digital Hive content store provides different views within the database that makes audit reporting very straightforward. While any reporting and analytics platform can be used, this document details what it takes to connect Microsoft PowerBI to the Postgres content store.

For more details about the Digital Hive audit database views: https://support.digitalhive.com/portal/en/kb/articles/default-auditing-explained
1- Within PowerBI desktop, click on the Get data button 
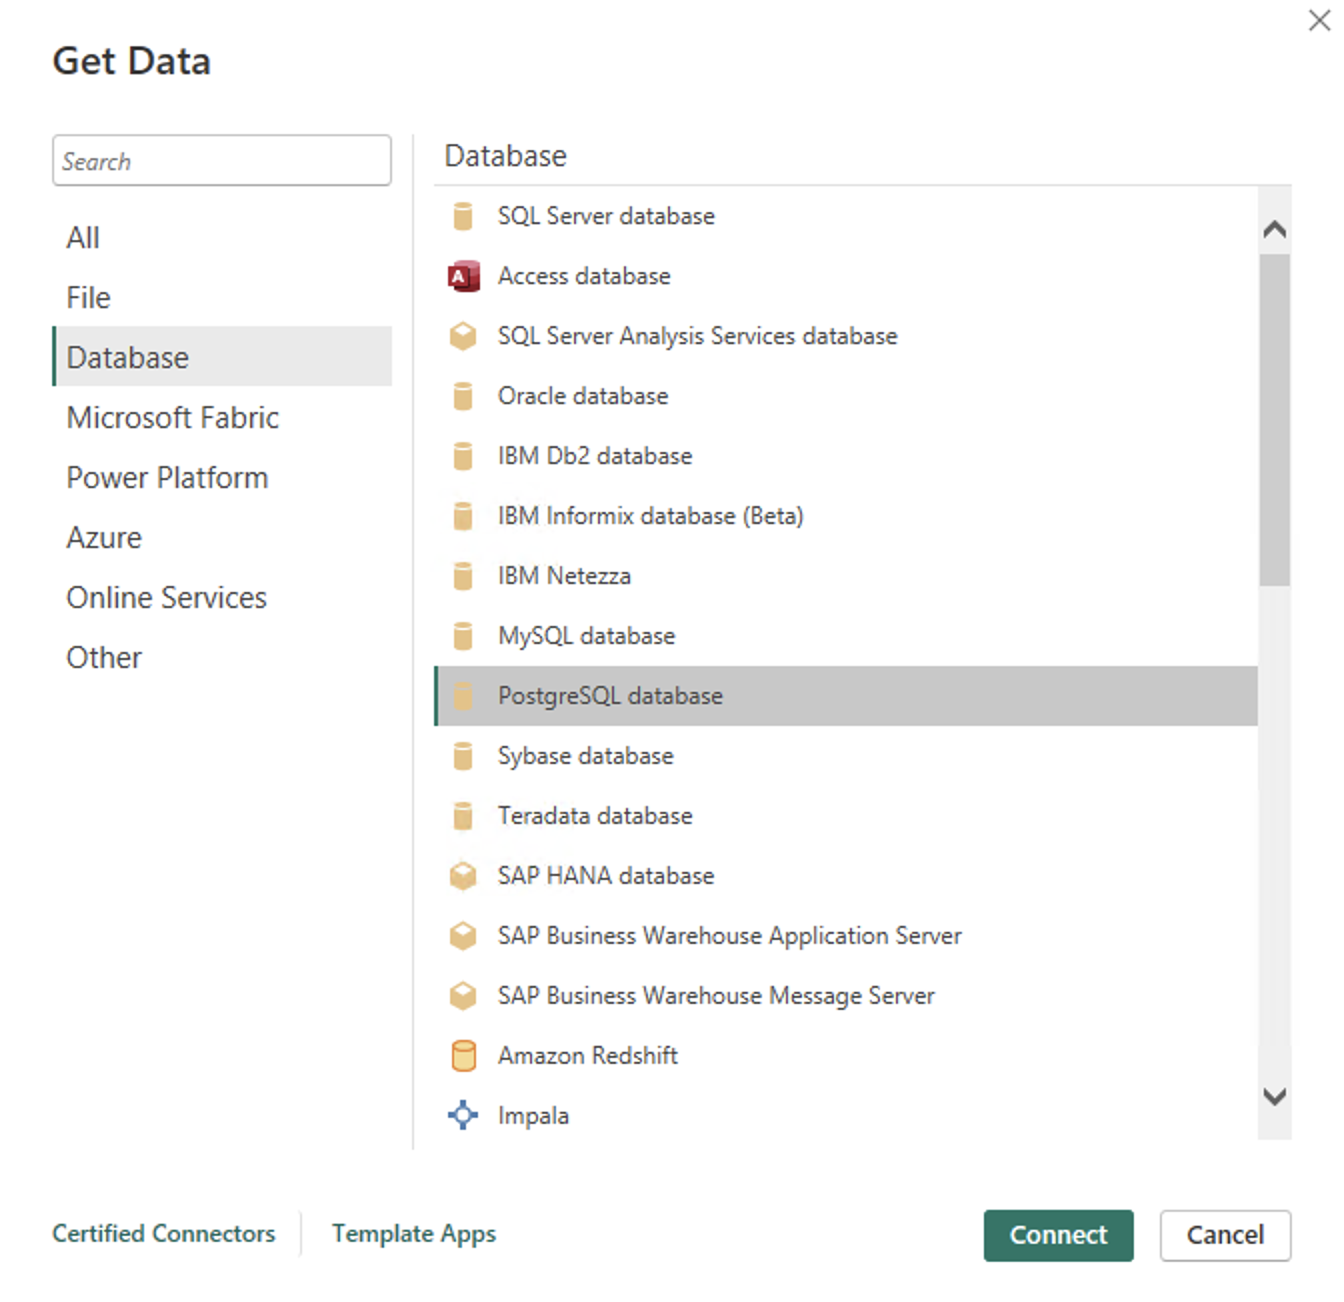
2- From the Get data dialog box, locate the PostgreSQL option, select it, and press Connect.
3- The next step requires configuring the connection details to the PostgreSQL server. Enter the Server address for the DIgital Hive content store
4- Type digitalhive for the Database name
5- Choose a connection strategy (either Import or DirectQuery)
6- Press OK
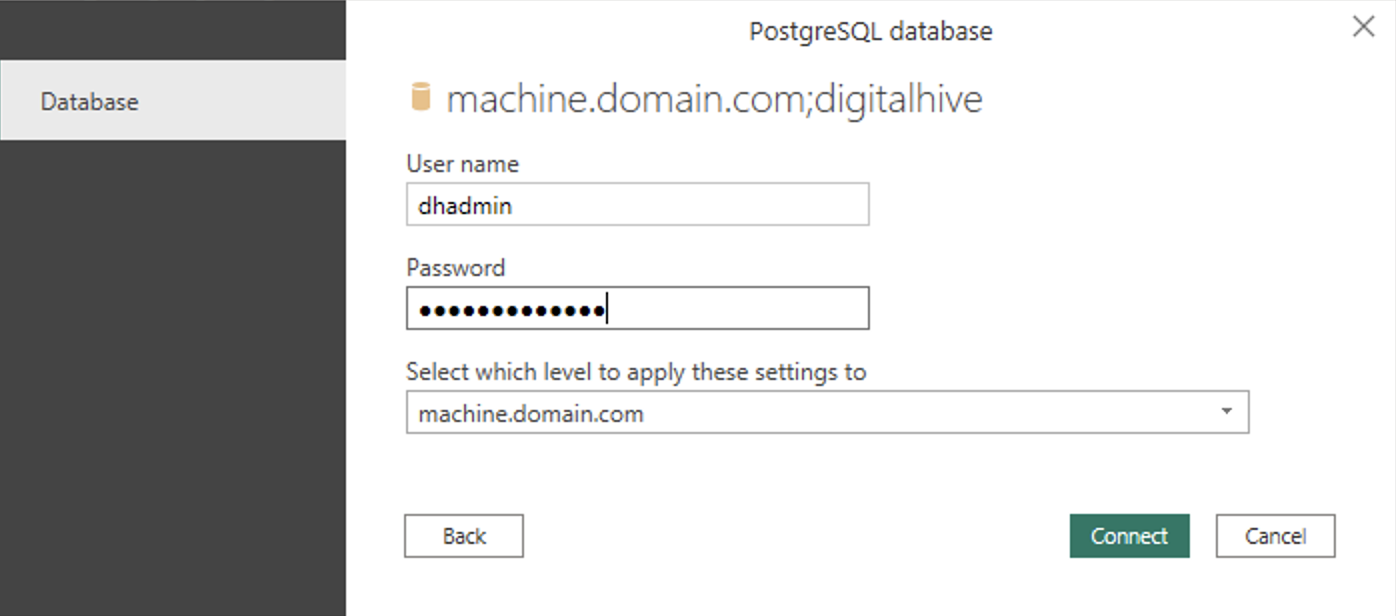
7- The next step is to input your PostgreSQL user details, that were created during the Digital Hive install process. 
8- Provide the user name dhadmin and whatever password was configured during the Digital Hive installation.
9- Press Connect
10- If a dialog box called Encryption Support is displayed, just click OK
11- The final stage, before data is imported into PowerBI, is to choose the content to be included in the PowerBI data model. Select the 5 audit views:
- theia_audit_admin
- theia_audit_page_views
- theia_audit_search_queries
- theia_audit_ui_interactions
- theia_audit_user_auth
12- Press Load
You have now successfully imported Digital Hive audit content into Microsoft PowerBI and can now visualize Digital Hive audit data.

Ensure that port 5432 is open and accessible so that the PowerBI server can access the Digital Hive PostgreSQL instance
Related Articles
Digital Hive Auditing Explained
Question The Digital Hive Control Center doesn't seem to provide any reports or views around usage of the platform. Is there a way to create reports to show metrics like the amount of reports executed by platform, the number of searches being made, ...What's New in the 2025.2 Digital Hive Release
What's New in the Digital Hive 2025.2 Release This articles details the new product features, enhancements, and resolved issues, that were included as part of the Digital Hive 2025.2 release. Prerequisites To move to this release, this must be a new ...Leveraging the Operational Visualizations in the Digital Hive Control Center
Overview This feature is available starting in the 2025.2 Digital Hive release. Administrators may require insight into adoption and utilization statistics to get a better understanding of the Digital Hive environment. There is an area within the ...Connecting to Microsoft PowerBI
Question How do we connect Digital Hive to Microsoft PowerBI? Answer As a Digital Hive administrator, connecting to Microsoft PowerBI can be accomplished via the following steps: Connecting Digital Hive to PowerBI requires that an app registration ...Connecting to Microsoft PowerBI Embedded
Question Is it possible to use Microsoft Power BI Embedded within Digital Hive? Answer This feature was made available in the 2026.1 release. As a Digital Hive administrator, connecting to Microsoft PowerBI Embedded can be accomplished via the ...